... literally and figuratively - I haven't had an alcoholic drink in over 12 months and while mulling over journal articles with a cold beer in hand seems appealing, I think I'll stick with my grog-less ways for the foreseeable future.
It's also been a while since my last blog post. Last semester left me reeling and re-evaluating a lot of my work habits (or non-work habits as the case may be). Though instead of trying to correct them over the break, I think I've been steadily reinforcing them. In an attempt to keep up the momentum of the last few weeks of class, I signed up to undertake a minor project over summer and try and get a head start on 2014. The whole thing has been an ordeal for me. While I handed in the first piece on time, I'm finding it a challenge just "getting" the next part and at 75% and with a few busy weeks ahead I need to "get it" to "do it". Having the blues doesn't appear to help matters either - nothing is clear and motivation is zilch when a cloud sits over your head.
So in an attempt to clear the cloud, understand the task and get on with it, I've returned to blogging. While blogging may seem to be more of a time-waster than a productive use of my time, I'm hoping that by airing concerns, thoughts and having some perceived accountability to my posts I'll be 1. a more efficient worker and 2. a better contributor to the LIS profession.
So many people are doing wonderful work out there - it's inspiring. It's also daunting for me as I haven't figured out my place in the profession or discovered what I'm most passionate about. People are writing journal articles and theses relating to the profession and I don't know if that's me. I want to be involved in digital literacy and promote the joys of reading so do I have to pursue an academic path? Can I still contribute without submitting journal articles? I'm trying to figure this out sooner rather than later, particularly as the deadline for our professional portfolios approaches and there are a number of elements I'm not sure how to tackle. We have to convey our skills and contributions through the work we've done both in and outside of class and while I've passed majority of assessment pieces, I'm not sure if I've done work of a high enough standard or of significance for presentation in my portfolio. There's also the matter of the outstanding 50 hours of professional placement that I need to undertake. I've sent out a few emails and am eagerly awaiting replies.
Before the end of February, I aim to have completed my minor project and to have made steps towards figuring out how I can contribute meaningfully to the profession in a way that suits me.
Tuesday, January 14, 2014
Saturday, October 26, 2013
Wrap-up Reflection
As per final post requirements, here are links to my completed play/ reflect activities:
Week 1:
General thoughts
Play/Reflect
Week 2:
Play/ Reflect
Week 3:
Play/ Reflect
Week 4:
Play
Reflect
Week 7:
Play
Reflect
Week 8:
Play
Reflect
Week 9:
Play
Week 11:
Play
Reflect
Week 12:
Reflect
Thinking back to week one I didn't really know what to expect of this unit. I was initially looking forward to blogging, hoping there would be an element of informality and reflection. In the end, as my task management isn't the greatest at the best of times, I found the exercise timely particularly as it seemed that we had to explicitly reference ideas rather than canvas themes. Maybe that was down to my interpretation of the task? In any case, the reflection that I conducted through blog posts allowed me to look beyond my own experiences and critically consider learning objectives.
The creation of Personal Learning Networks (PLNs) is a task that I'd already started carrying out in Semester One through being an active participant of uni orientated facebook pages and designated hashtags on twitter. I've also added several members of my cohort and lecturers to my LinkedIn profile. As I was already signed up to Facebook and Twitter I didn't really have an issue with being signed up to these platforms for class. However, if I wasn't already signed up I'd be resistant to the idea of the uni telling me that it was compulsory, even if this course is about information technology and information programs. Like some other students have chosen to do, I'd likely keep my identity secure through using a different name and no image. The challenge with this would be that exposure to future employers would be limited and classmates wouldn't always know who their classmates are. This could possibly affect the success of PLNs being developed. On the other hand, using your real name and image may not work in your favour if your posts are controversial or irrelevant; considering my online persona and etiquette was important. Despite these concerns, I thought the learning environment operated in a fairly functional manner.
I'm usually a fan of the dual learning mode because I'm based on the Gold Coast. However, I don't think I took advantage of this in INN333 as much as I have in the past. From memory I attended one blackboard collaborate session, no in-class sessions and didn't listen to any recordings. I'm not sure if this is because:
a) there were so few "physical" classes that I'd forget and become complacent or
b) whether it was because I was more concerned with other classes or
c) whether I was happy enough conducting my own learning through the extensive resources provided. I liked the convenience of watching the videos provided in the learning resources and the clear instructions outlined in the play tasks.
I don't want to go into too much of a deep analysis of the collaborate session I participated in but there were technological issues I found frustrating and I wondered if the content discussed was relevant to other students outside the library major. I also think that had the guest speakers been better prepared in regards to the collaborate technology, they would've been made more comfortable addressing the class and as a student, I would've felt more connected to the discussion. In saying this, I thought the content was interesting and offered food for thought in relation to identifying possible service gaps and how information programs could possibly be incorporated to meet user needs and expectations - ideal for assignment two.
Incorporating social media into the learning environment had both pros and cons. These are outlined below:
Pros:
- quick and supportive responses from the cohort
- the sharing of interesting and informative ideas
- got to clarify ideas
Cons:
- sometimes delayed responses from people (although I had high expectations regarding response times because of the precedence set by other classes)
- bombardment of information - it was sometimes a challenge to stay on top of it all
- sometimes challenging to discern what information was highly important and not so important. I think this could've been managed through "pinning" posts on Facebook, emailing important messages to students and encouraging students to use the search capabilities on the group page to identify topics or posts by particular people
- interaction with others on Twitter were limited. I found managing contact on Facebook and blogger took up most of my time and people got in touch with me most on those platforms.
Overall, I found the weekly activities to be enjoyable and I was excited to be introduced to technologies and concepts I'd never heard of or tried before. Many of the new ideas I was introduced to will be revisited throughout my studies and beyond, including: the free screencasting software, Google forms, online curation tools and mashups. I found most technologies easy to grasp (although the screencast software I selected - CamStudio - required some trial-and-error testing) and in hindsight probably I should've selected the more challenging of the play activities to expand my skill set further.
If time permits, I will revisit some activities and concepts because while we were encouraged to look at all topics, you definitely direct your own learning in this unit and I found that I steered away from unfamiliar areas. It's because of this that I would like to get a better understanding of gamification, app construction and open data.
The key learning outcomes I believe I achieved from this unit include:
- the importance of being aware of new technologies, their functionalities and their potential particularly in an information organisation (I believe this knowledge would make me an integral member of an information organisation)
- the cost effectiveness of using these technologies to minimise service gaps and maximise user satisfaction (to encourage service adapatability and highlight user experience mindfulness)
- the scope of information available and the potential for that information to be transformed into new services or technologies (this was highlighted to me in the mashup analysis in week 11)
- that it is important to be aware of other peoples limitations in terms of technology accessibility
I look forward to incorporating these ideas into my studies and future workplaces.
Sunday, October 20, 2013
Week Twelve - Reflect Activity
Online applications - a comparison of polling platforms
Pick two online applications (including at least one that you've never used before) to test, evaluate, compare and contrast. They should provide similar function, for example both mind-mapping tools, to-do lists, survey apps, meeting/polling tools etc. Prepare a reflection of at least 300 words or 90 seconds. Do you recommend either for personal or professional use? Why or why not?
Although I didn't choose to do the play activity this week there was a play element to the reflect activity. I wanted to look at polling tools and designed a survey for classmates through Google Drive and Survey Monkey. These tools were then evaluated, compared and contrasted.
The first survey was created through Google Drive. Until this course I wasn't even aware that I was able to create a poll through Google Drive and was excited to try this service. I wanted to find out which tools canvassed in the course, my peers would be likely to use again in their work life. As I wanted to get an idea of all the tools an individual would use in their work life, I allowed participants to select more than one option. I also wanted to find out the popularity of tools, and while the numbers won't be exact, common selections will be able to be viewed. Initially the wording of my question wasn't clear - at first it would've appeared that I only wanted one choice to be selected - this has since been amended.
This polling platform was easy to use and the guided choices simple to follow. I also encouraged discussion about the survey (in terms of its design) on Facebook and people thought the query was worthwhile and would assist in the reflection component of the course.
The results of the survey were displayed in a spreadsheet with a column named "time stamp" and another column outlining the selections made by participants. I liked the idea of the time stamp but the overall aesthetics were displeasing. There was no totalling of responses or graphical element to the data. There may be an option to see it in a graph-type layout, but at this stage, because results are still incoming, this option has not been explored. As a survey participant for another classmates survey, it was found that their survey results were displayed in a graphical format so I would like to explore this occurrence further.
For the second survey I chose to find out the views of my classmates on blogging as part of uni studies through Survey Monkey. This platform was equally as easy to use. I opted to ask four questions in this survey to find out about the blogging experiences of my classmates and these were easy to set up. On Facebook one student expressed that one of the questions was confusing due to the wording and a change was made to improve the clarity.
The results page was colourful and easy to read with data being shown in both graphical and textual formats. The use of percentages also made for an easy to understand break-down of responses. Compared to the Google-based survey, the results analysis provided by Survey Monkey was definitely more straight forward and easy to understand.
Overall, each poll was simple to set up and navigate. In order for the surveys to be effective the content and layout of the content played a key role. Due to the formatting of the results page I believe Survey Monkey is the better of the two tools for professional use. The percentages and graphs make the result display look more professional and easier to figure out the information provided. However, people should be mindful that while Survey Monkey is free for a small number of surveys and responses, it does cost money for those features to be increased. Google forms on the other had are free and would definitely be beneficial for those attempting to undertaking a quick survey or preparing something for personal use.
Sunday, October 13, 2013
Week Eleven - Play Activity
Do the monster mash(up)...
 Sky and footballer images are my own. House image found through SLQ's Picture Queensland collection and is titled "Rear view of Mostyndale homestead Springsure ca. 1917".

 Footballer image is my own. "Jim Owens Chevrolet truck off the road in the Nambour district ca.1925" image found through SLQ's Picture Queensland expired copyright collection.
These images can also be found on my Flickr account here. Eventually I want to attempt other variations of the mashup concept and see what new services or videos I can create.
Week Eleven - Reflect Activity
Mashups and the creation of new services
Following on from the mashup play activity this week's reflect saw other mashups evaluated. The task was as follows:
Choose a LibrayHack data mashup entry and prepare a critical commentary on it. Consider questions like: What data inputs were used? What does the end product do? How successful do you think it is?
I looked through each of the winning entries and each creation partnered different pieces of data to create amazing work. A couple of mashups stood out to me in particular. One was an image mashup created by Andrew Young titled "Reflection of Time". It shows a city scene from the 1920s sourced from the Victoria State Library with a modern day night scape reflected in the street. Through clever editing and the use of their own images for the night scape, the artist successfully showcases their intention through the mashup: "a glimpse into the future". It made me consider how much and how quickly technology has changed over time and how it is constantly evolving.
The other mashup that I thought brought several data elements together in a really effective manner is Micahel Henderson's "Talking Maps". Henderson used several data sources and several online sources to create four historical stories. These stories give insight into Brisbane's past and the journey of the H.M.S Endeavour through the use of maps, music, narration, interviews and photos. Links are clearly displayed and the mashup is fairly intuitive. I really only had time to explore one of the historic journeys and selected "Walking West End". I was amazed by the amount of information provided by the combination of elements and thought the various mediums encouraged exploration. My interest was held because of these mediums as well. I think the experience could've been improved if there was a how-to use guide, otherwise the concept and product were highly worthwhile. A brief list of data sources are described here and the project can be accessed here.
Following the review of these mashups I'm inspired to look into how I can create something similar to Talking Maps. I think mashups in this vain can be used for educational purposes, promote history (particularly from a local point-of-view) and also create an awareness of the scope of information freely available to all.
Sunday, September 22, 2013
Week Nine - Play Activity
QR Codes
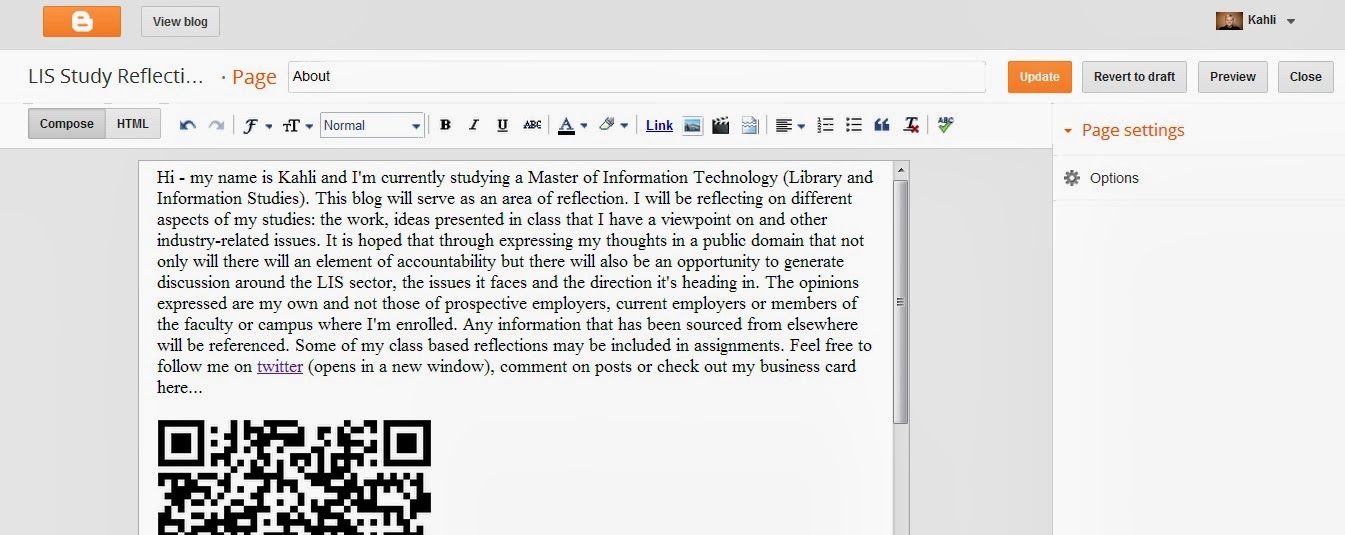
I chose to carry out the the basic play activity for week nine. There were two parts to undertake. Part A required students to use a free QR code generator to create a business card for the "About Me" page on their blog. Below are images showcasing the QR code generator I used and the where I embedded the code on my blog (click on images to enlarge).

The second part of the basic task required students to download a QR scanner app to their smart phone to scan a QR code with a secret message supplied by the lecturer. The app downloaded is called "Scan" and is extremely simple to use. The code was deciphered using the app and the "hidden" message passed on the lecturer via twitter. As this week's task was completed late in the evening I've decided to add a print screen of the deciphered code below:

I also used the scanner app on my phone to verify whether my QR code business card was successful and I'm pleased to say it was. To view the QR code head to the "About Me" page.
I enjoyed the activity and was excited to download and try a new app. However, I realised following the activity, that if one did not own a smart phone or device, how would the activity be carried out? As I'm fairly new to owning a smart phone, this point stood out to me and while smart device use is prevalent, considerations have to be made for those who don't have access to these technologies. It's for this reason that I believe while QR codes are a unique and convenient way to make information available to people, it shouldn't be a technology relied on by organisations based on exclusivity.
Sunday, September 15, 2013
Week Eight - Play Activity
Screencasting - The good, the bad and the ugly
If you want to skip the spiel and watch my video guide, head to the bottom of my reflections. Feel free to only watch a minute or so as it is a lengthy video. Thank you!
I've always been interested in making instructional videos but never took the time to investigate how I might go about it. The play activity for this week required students to put together a screencast offering a "how to" of a particular library catalogue or database. Excited by the opportunity to test some unfamiliar technology, I chose to show how the Gold Coast libraries catalogue could be accessed from the council page and how you could use the catalogue to find an on-line-accessible audiobook.
It took me some time to find an adequate screen capture tool for the task. VLC media player doesn't capture audio when recording screencasts and I didn't completely trust Screen Capturer Recorder or how long it took to put the video together. I settled on CamStudio and after some menu trawling, was able to find the settings that suited the capture I was looking to record. For your reference, these are the options I selected to put together my video:
It took me some time to find an adequate screen capture tool for the task. VLC media player doesn't capture audio when recording screencasts and I didn't completely trust Screen Capturer Recorder or how long it took to put the video together. I settled on CamStudio and after some menu trawling, was able to find the settings that suited the capture I was looking to record. For your reference, these are the options I selected to put together my video:
- Under "Region" I changed the default setting from "Fixed Region" to "Full Screen".
- Under "Options" I changed the following default settings:
- "Do not record audio" -> "Record audio from speakers"
- "Audio Options for Microphone" -> selected "Internal Mic..." under the "Audio Capture Device" heading
- "Record to Flash Options" -> deselected all options
- Under "Program Options" in the "Options" tab I selected "Minimize program on start recording", "Hide flashing rectangle during recording", "Save settings on exit", "Capture translucent/layered windows"
- "Play AVI file when recording stops" -> "Do not play AVI file"
- "Directory for recording" -> "Use user specified directory..."
- "Name of AVI file" -> "Automatic file naming (use date and time)..."
I also ensured that it stated "Record to AVI" in the top right hand corner of the white CamStudio display.

It is also important to be aware that in order to stop the recording you need to show the hidden icons in the bottom right hand corner of the systray, right click on the CamStudio icon and hit stop. Following this, CamStudio will take a minute or so to compress the file. Once it's finished the compression, you should be able to view your recorded file in a media player. If you decide you want to re-record the capture, triple check your setting adjustments haven't returned to the default settings.
It took me a few attempts to end up with an OK recording; the technology worked fine but my inadequate planning led to lengthy and misguiding instructions. As it is, despite being advised to aim for a 3 minute video, my capture goes for 8 minutes. This may have something to do with the content I was canvassing as well.
Click on the bottom right hand icon to enlarge video
Overall, I'm glad this task pushed me to gain exposure to this technology. I will definitely use screencasting in the future and may even revisit my first attempts to produce something more succinct.
Key points learned from this exercise:
- it pays to do your research into what screen capture tool is right for you
- taking the time to navigate and understand how the tool functions makes the job easier
- have a rough idea of what you're going to say and where you're going to navigate to avoid any surprise results (a script might help even further). This also will enable you to have a shorter, more accessible video.
Subscribe to:
Posts (Atom)